Why Businesses Must Move Beyond Spreadsheets
For years, businesses have relied on spreadsheets to track data, manage operations, and analyze performance. While spreadsheets can be useful for simple tasks, they quickly become inefficient, error-prone, and difficult to scale as businesses grow.
Modern businesses need real-time data visualization tools that provide instant insights, predictive analytics, and AI-powered reporting to make faster, smarter decisions. At ROOK Connect, we help companies transition from static spreadsheets to dynamic, interactive dashboards, ensuring data accuracy, automation, and real-time business intelligence.
The Goal:
- Eliminate manual spreadsheet tracking.
- Implement AI-powered dashboards for real-time insights
- Improve data accuracy efficiency, and collaboration
- Enhances collaboration across all departments.
- Enable predictive analytics to anticipate trends.
- Provide executives with live business intelligence for decision-making.
The Hidden Costs of Spreadsheets
Many businesses don’t realize how much spreadsheets are costing them in time, productivity, and accuracy. Here are some major pain points we solve:
Human Errors & Data Inconsistencies

Problem: Spreadsheets rely on manual data entry, leading to inconsistent records, formula errors, and inaccurate reporting

Solution: ROOK Connect implements AI-driven data entry and validation tools, eliminating human errors and ensuring 100% accuracy
Time-Consuming Manual Updates
Problem: Employees spend hours updating spreadsheets, leading to productivity loss and outdated information
Solution: Our automated data visualization tools update in real time, reducing workload and allowing teams to focus on high-value tasks
Lack of Real-Time Insights
Problem: Spreadsheets provide static data, meaning businesses rely on past performance instead of real-time insights
Solution: We implement live dashboards that provide instant analytics and predictive forecasting, ensuring proactive decision-making
Limited Collaboration & Data Silos
Problem: Spreadsheets are difficult to share and collaborate on, often leading to version conflicts and miscommunication
Solution: Our solutions enable real-time data sharing, ensuring that teams always have access to the most up-to-date information
No AI-Powered Predictive Analytics
Problem: Spreadsheets only offer historical data analysis, preventing businesses from forecasting trends and optimizing operations
Solution: We integrate machine learning-powered predictive analytics, allowing businesses to anticipate risks, trends, and opportunities
4 Reasons to Replace Spreadsheets with AI Dashboards
ROOK Connect’s Data Visualization & AI Reporting Approach
We don’t just replace spreadsheets—we transform data management with real-time dashboards, AI-powered automation, and predictive analytics.
Step 1: Spreadsheet Dependency Analysis
We evaluate how your business uses spreadsheets and identify inefficiencies.
- The volume of manual data entry.
- Current data accuracy and inconsistencies.
- The need for real-time insights vs. static reports.
- Collaboration challenges and data silos.
Step 2: AI-Powered Dashboard Implementation
We build and customize real-time dashboards tailored to business needs.
- Automated data aggregation from all business systems.
- Interactive visual reports with real-time updates.
- User-friendly, no-code interfaces for easy adoption.
Step 3: Machine Learning-Powered Data Insights
We integrate AI-driven analytics to provide deeper business insights.
- Predictive analytics to forecast trends and risks.
- AI-powered anomaly detection for early issue identification.
- Automated reporting that updates in real time.
Step 4: Workflow Integration & Automation
We eliminate manual spreadsheet workflows with automated data pipelines.
- Connects financial, operational, and sales data into a single dashboard.
- Eliminates the need for manual spreadsheet tracking.
- Reduces errors and duplicate data entry.
Step 5: Continuous Optimization & Future-Proofing
We ensure long-term success with continuous dashboard optimization.
- AI models that continuously learn and improve accuracy.
- Scalable reporting tools that grow with the business.
- Seamless updates to adapt to new industry trends.
Take The Next Steps With ROOK Connect
The ROOK Team Works With Businesses
Developing Strategic Big Data Analytic Systems
That Drive
Efficiencies & Deliver Predictive Analysis!


Key Benefits of Moving from Spreadsheets to
AI-Powered Dashboards
Businesses that replace spreadsheets with AI-driven data visualization experience:
- 90% reduction in manual data entry.
- Instant access to real-time reports and analytics.
- Higher accuracy with AI-powered data validation.
- Seamless collaboration with cloud-based dashboards.
- Smarter decision-making with predictive analytics.
- Automated workflows that eliminate repetitive tasks.


From Spreadsheets to AI-Powered Insights
Customer:
Enterprise Logistics Company
Challenge:
The company relied on hundreds of spreadsheets to track shipments, inventory, and costs, leading to errors, delays, and operational inefficiencies
Solution:
ROOK Connect replaced spreadsheets with a real-time AI-powered logistics dashboard, integrating inventory, shipment tracking, and predictive analytics
Future-Proof Your Data Management
with AI-Powered Dashboards
Spreadsheets can’t keep up with today’s fast-moving business world. At ROOK Connect, we help companies replace outdated, manual spreadsheets with real-time, AI-powered data visualization tools, ensuring faster, smarter, and more accurate decision-making.
Ready to move beyond spreadsheets? Contact ROOK Connect today and transform the way you analyze, report, and manage business data.
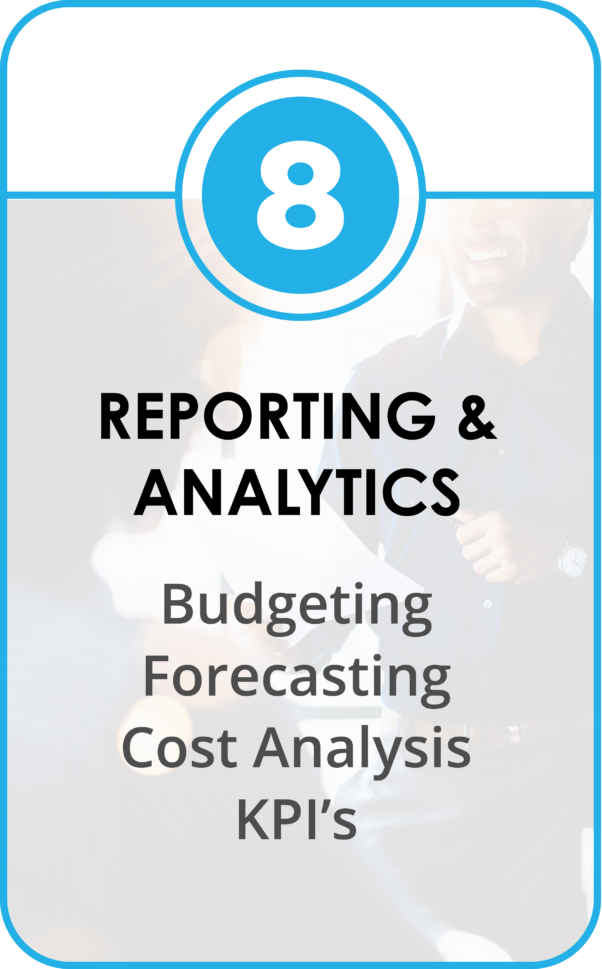
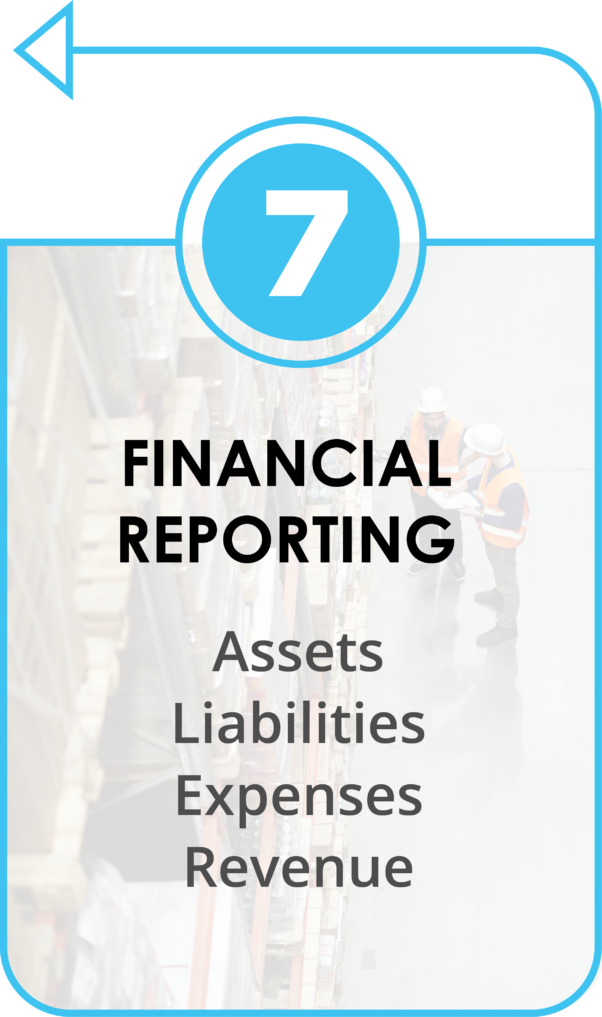
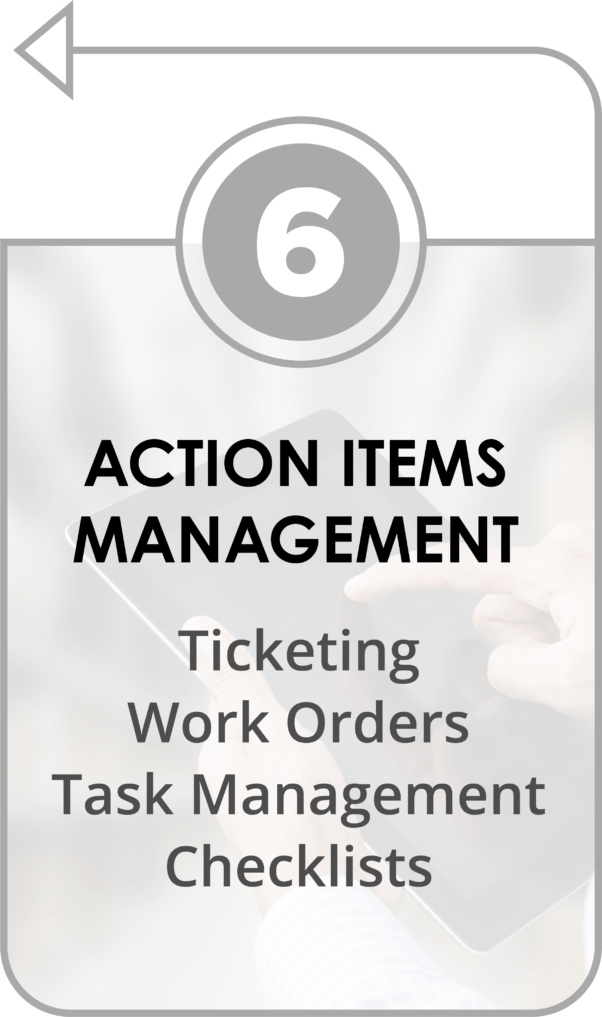
8-Step Process to Transition from Spreadsheets to
AI Dashboards